One point that’s come up a couple of times is the expense of imposing serious infection controls. China probably lost hundreds of billions of dollars on controlling the outbreak in Wuhan. Let’s try to make a guess of how much it would cost us, and use that to figure out what the best path forward is.
For starters, let’s take some reference points. Assume that completely uncontrolled, the R0 for the virus is 2.0. This probably incorporates small personal, relatively costless changes like better handwashing, sneeze and cough etiquette, etc. Evidence from China suggests that their very strong controls brought the R0 down to about 0.35. We’ll assume that those level of controls mostly shutdown the economy, reducing economic activity by 90%. U.S. 2019 GDP was about $21.44 trillion, so we can estimate the daily cost of these extremely stringent controls in the U.S. as being about $50 billion.
Next, we’ll guess that the daily cost of imposing controls gets harder as you go lower – it’s not linear in R0. Instead we figure that every 1% reduction in R0 costs the same amount. So, to drop R0 from 2.0 to 0.35 we estimate would cost about $50 billion, and thats 173.42 1% reductions, so each 1% reduction would cost about $288 million dollars per day. There’s one other thing to keep in mind for cost accounting: it’s much, much cheaper to impose controls when the total number of infections is low. In the low regime, you can do contact tracing and targeted quarantine rather than wholesale lockdowns. So if the total number of infections in the population is below 1,000, we’ll divide the cost of controls for that day by 500.
Finally, we need to balance the costs of infection controls with the benefits from reduced infection and mortality. All cases, including mild, non-critical cases, cost personal lost income: about $200 a day (median income of ~70K, divided by 365). For critical cases in the ICU, about $5000 a day For critical cases in a general hospital bed, about $1200 a day. For critical cases at home, no additional marginal cost. Deaths will cost $5 million.
Now we can make a back of the envelope estimate of the costs and benefits of different courses of infection control.
We’ll impose infection controls on day 130, when there’s 30 dead and 30,500 infections out there. Then we’ll sweep through different strengths of controls and see what the total costs look like over the whole course of the epidemic.
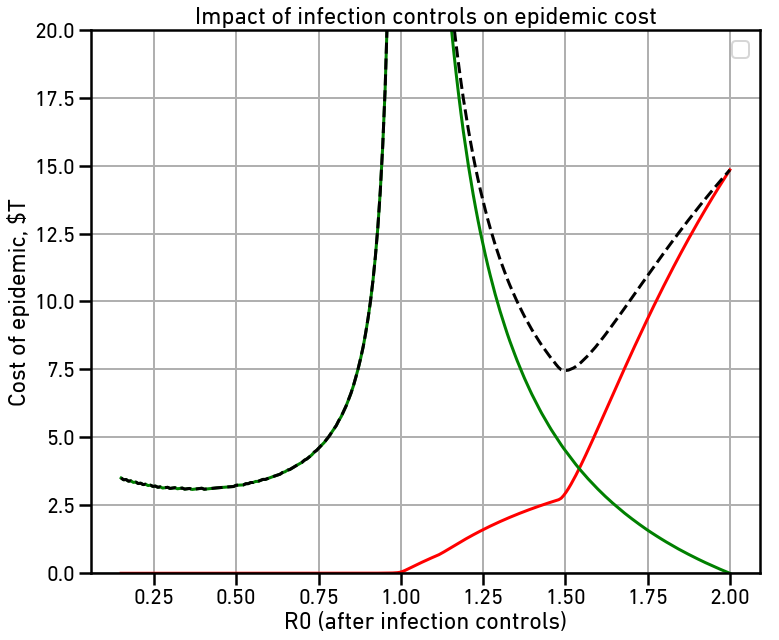
The red line is the cost of the disease itself, largely due to deaths. The green line is the cost of maintaining infection controls throughout the epidemic. The dashed line is the total cost, all in billions of dollars. Note that with no controls, our estimate of the total cost to the US is $14.8 trillion dollars, or about 2/3 of the total US GDP.
There are two local minima on the total cost curve. The first is right around R0=1.50. This makes the spread slow enough that hospital capacity is never overloaded, greatly reducing the number of deaths and thus the cost of the disease. This reduces total cost to $7.45 trillion dollars, just about half of what the uncontrolled cost would be. Note that even with this small amount of reduction, the majority of the cost is due to the controls rather than directly due to the disease.
The second local minima is at the far left, right around at R0=0.35, or about what the Chinese managed in Wuhan. This slows the spread of the disease so fast that we rapidly enter back into the much cheaper contact-tracing regime where wholesale lockdowns are no longer necessary. This reduces total cost to $3.11 trillion dollars, half again the cost with only moderate controls.
The cost savings with very serious controls imposed as soon as possible comes from two sources: First, lower disease burden in deaths, hospitalization, and lost productivity. Secondly, it’s cheaper to impose very serious controls because they need to be imposed for a much shorter period of time to control the disease.

Thanks. Any chance of making these models interactive online?
LikeLike
I’ll try, but it’ll take a bit.
LikeLiked by 1 person
lol, people don’t realize that a ‘simple interactive model’ is quite an undertaking if that kind of work isn’t already your day job.
Here it is with some sliders:
https://pastebin.com/xZvUMqWN
The logic underpinning start_day is not working.
LikeLike
How can be possible infinite progression of the pandemia (R=1)? The number of people who can be infected is limited.
LikeLike
Hi! This is the sort of analysis I’ve been waiting for. Thanks for making it. Big question: On the first local minima: wouldn’t the exponential trend pick up again after the controls are stopped? And on the second local minima: wouldn’t the exponential growth also pick up again as soon some people’s sickness is leaked (i.e. not covered by contact tracing?).
LikeLike
Also for the second local minima:
> This makes the spread slow enough that hospital capacity is never overloaded, greatly reducing the number of deaths and thus the cost of the disease.
How do we know the hospitals are not overloaded? My back of the envelope calculation indicated that r = 1.5 would still lead to a massive shortage of beds. Can you say a bit about how r = 1.5 avoids that scenario?
Thank you so much again!
LikeLike
It’s probably too optimistic. My model is assuming 900,000 available hospital beds every day, that 5% of infections are critical and need hospital care, and that they need it for 12 days on average. 5% is probably about right for ICU-level care needed, but it looks like 20% total hospitalization is more accurate, and the Italians have been saying that some critical cases have needed beds for weeks.
LikeLike
In this model, the controls never stop until there are no infections. In the real world, we’d still have to worry about missing cases and reinfection from abroad, so international travel restrictions, contact tracing, and random testing would have to continue until the global outbreak is over.
LikeLiked by 1 person
Sorry – additional comment: I think a very important thing to model is *when to start the measures* and not only how heavy they should be. I’d argue that while in your model r = 1 gives extremely high costs, in a model where you can select when to reduce r to r = 1, it is perhaps the best number to choose:
https://www.facebook.com/algekalipso/posts/2850373818388090. (I know – this should be a blogpost, but just linking you here for now)
LikeLike
No. You’ve got a couple of errors.
Japan & South Korea have not reduced the growth rate below 1. They’ve still got accelerating case loads, just slower than most other countries. China, Singapore, and Hong Kong, AFAICT, all have.
Second, there’s two kinds of infection controls you can take: broad-scale, acting on a whole region or country, or targeting, acting on specific individuals with the disease or in contact with known infection risks. Effective broad-scale measures are very expensive and require more or less complete shutdown of the economy. Targeted measures can be very effective as long as the caseload is low. If you can keep the number of infections below a few thousand, and you have sufficient tracking and testing infrastructure to detect new infections, you can keep the virus down without shutting down the economy. These targeted measures are what Singapore and Hong Kong are doing, as far as I can tell, fairly effectively. But you have to get to the regime where it’s possible; you can’t do it when there’s a million infected people in the country. And the best way to get there is very strong broad-scale measures implemented as soon as possible.
LikeLiked by 1 person
An engineer friend noted a major problem with your BOTEC calculations. Your estimated average cost of death, $5 million, is not supported by the Wikipedia link you provide. In any event, most deaths will occur to the elderly and those whose economic value is already diminished by other disabling ailments. A more reasonable estimate is likely to be at least one and probably two orders of magnitude smaller.
LikeLike
I’m pulling from the US Estimates table, these lines:
$9.1 million (Environmental Protection Agency, 2010)[33]
$7.9 million (Food and Drug Administration, 2010)[33]
$9.2 million (Department of Transportation, 2014)[34]
$9.6 million (Department of Transportation, Aug. 2016)[35]
Note that the smaller numbers above these lines are the estimated costs of a year of life, not the estimated costs of a life. I rounded down to 5 to half-heartedly adjust for the age factor.
LikeLike
Is the fact that the “crush the curve” local minimum ended up located at 0.35 (i.e. China more or less nailed it, without too much if any overkill, under this model) somehow baked into your parameter choices? Or is it a genuine reflection of the sagacity of the mandarins in Zhongnanhai?
LikeLike
Well, it’s a byproduct of the parameter choices, but I didn’t pick those parameters so that it came out that way. I picked the parameters first, and the results are what happened.
LikeLike
Thanks for the model and discussion. You focus on the key factors. Tomas Pueyo (LinkedIn profile) is a Silicon Valley startup entrepreneur-engineer who authored Coronavirus: Why You Must Act Now at medium.com on March 10 (updated 3/13/20). He comes at this from a different (but still quantitative) angle, and with a finer-grained approach. From 20,000 feet, his conclusions seem consistent with yours.
LikeLike
These figures are basically wrong.
A QALY is worth $50k-$150k. The typical person dying might be losing 5-10 years (average age of death ~80) at a PARTIAL or often low quality of life. The “cost” of a death is closer to $500k in standard medical terms. (And any medical costs might actually substitute out for MUCH LARGER costs typically spent to prolong life for brutal, unnecessary months at end of life.)
LikeLike
“with no controls, our estimate of the total cost to the US is $14.8 trillion dollars, or about 2/3 of the total US GDP.”
The idea that the US loses 67% of annual GDP from the deaths of 5-20% of of the age 70+ population is patently absurb. If they all died, would we lose 5x the GDP? No.
We’d lose maybe a couple percent of GDP if you assign standard QALY values for each year of fully active healthy life they have remaining (which may be less than a year for some who die from COVID who were already immobile and chronically ill).
The only place to start a serious analysis is with a serious value of life estimate like those used throughout the medical literature.
LikeLike
Does it make sense to use cost of QALYs at all here? This is supposed to be a purely economic impact analysis, and I doubt the economic impact of 80+ year olds dying is negative.
The goal should be to figure out the economic cost per QALY saved of mitigation vs. suppression.
LikeLike
Incorporating the economics of the relationship between herd immunity and R0 should probably also include over-shoot investment in R0 suppression, which, which investment is reduced, results in a resurgence of this highly-contagious disease. Control systems theory can then optimize.
LikeLike